Integrated Annual Report 2012
We consider that measuring performance against set targets and objectives is a significant factor for self-improvement. Thus we engage with experts and stakeholders seeking meaningful ways to understand and record the added value created for TITAN and its stakeholders. This is a long-term, on-going and challenging process which initiates change at all levels.
In 2012, we moved a step further, engaging in a review of the socio-economic impacts of TITAN operations, along with the impact on the environment. We requested stakeholders to provide us with feedback, so as to develop a meaningful way to record, measure and report these impacts.
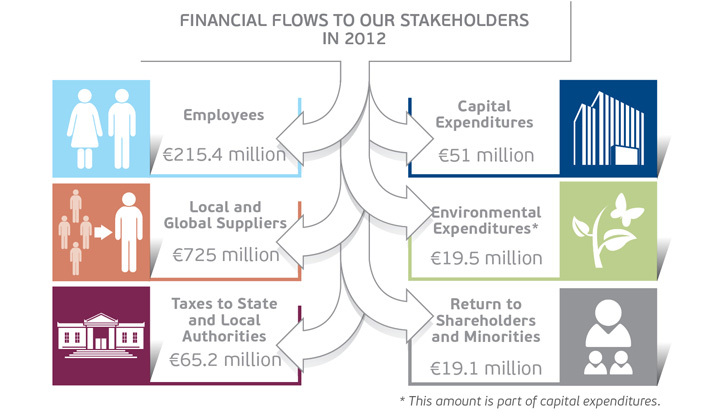
Distribution of value created by TITAN Group 2008 - 2012
| 2008 | 2009 | 2010 | 2011 | 2012 | |
| To employees for salaries, pensions and social benefits, including additional benefits beyond those provided by law | 267.3 | 235.1 | 239.1 | 218.1 | 215.4 |
| To local and international suppliers | 936.6 | 768.0 | 801.8 | 642.9 | 725.0 |
| For new investments in fixed assets | 209.1 | 180.0 | 87.2 | 58.1 | 51.0 |
| To state and local authorities through taxation | 102.7 | 124.9 | 90.0 | 82.6 | 65.2 |
| Return to shareholders and minorities | 35.5 | 15.2 | 17.2 | 24.9 | 19.1 |
| Total | 1,551.2 | 1,323.2 | 1,235.3 | 1,026.6 | 1,075.7 |